317
A self-initiated project, 317 is an exploration of how emotionally close versus how geographically close the people I have met in my life are to me. Selected to appear in the Adobe Museum of Digital Media and published in information design books across the globe.


The matrix of friends, followers, and fans on services such as Facebook and Twitter is often described as a “social graph”—a network that takes on a physical, graphical shape as relationships are linked and connections are made.
This social graph, though, is rarely given such beautiful form as in 317, a sublime work by Carolina Andreoli. In this disarmingly simple visual display, Andreoli reflects on the intersections of physical space and emotional space: every colored ring is an individual, with the color representing where Andreoli met them. The placement, from left to right, signifies how emotionally close she feels to each person, with a graph indicating what medium she uses to stay in touch with them: phone, e-mail, or Facebook. Finally, at the bottom there is a timeline that indicates when she lived in or visited various countries.
It is a stark and unexpected statement on how relationships in this digital era are linked inextricably to the way we choose to communicate.
— THOMAS GOETZ CURATOR OF THE ADOBE MUSEUM OF DIGITAL MEDIA

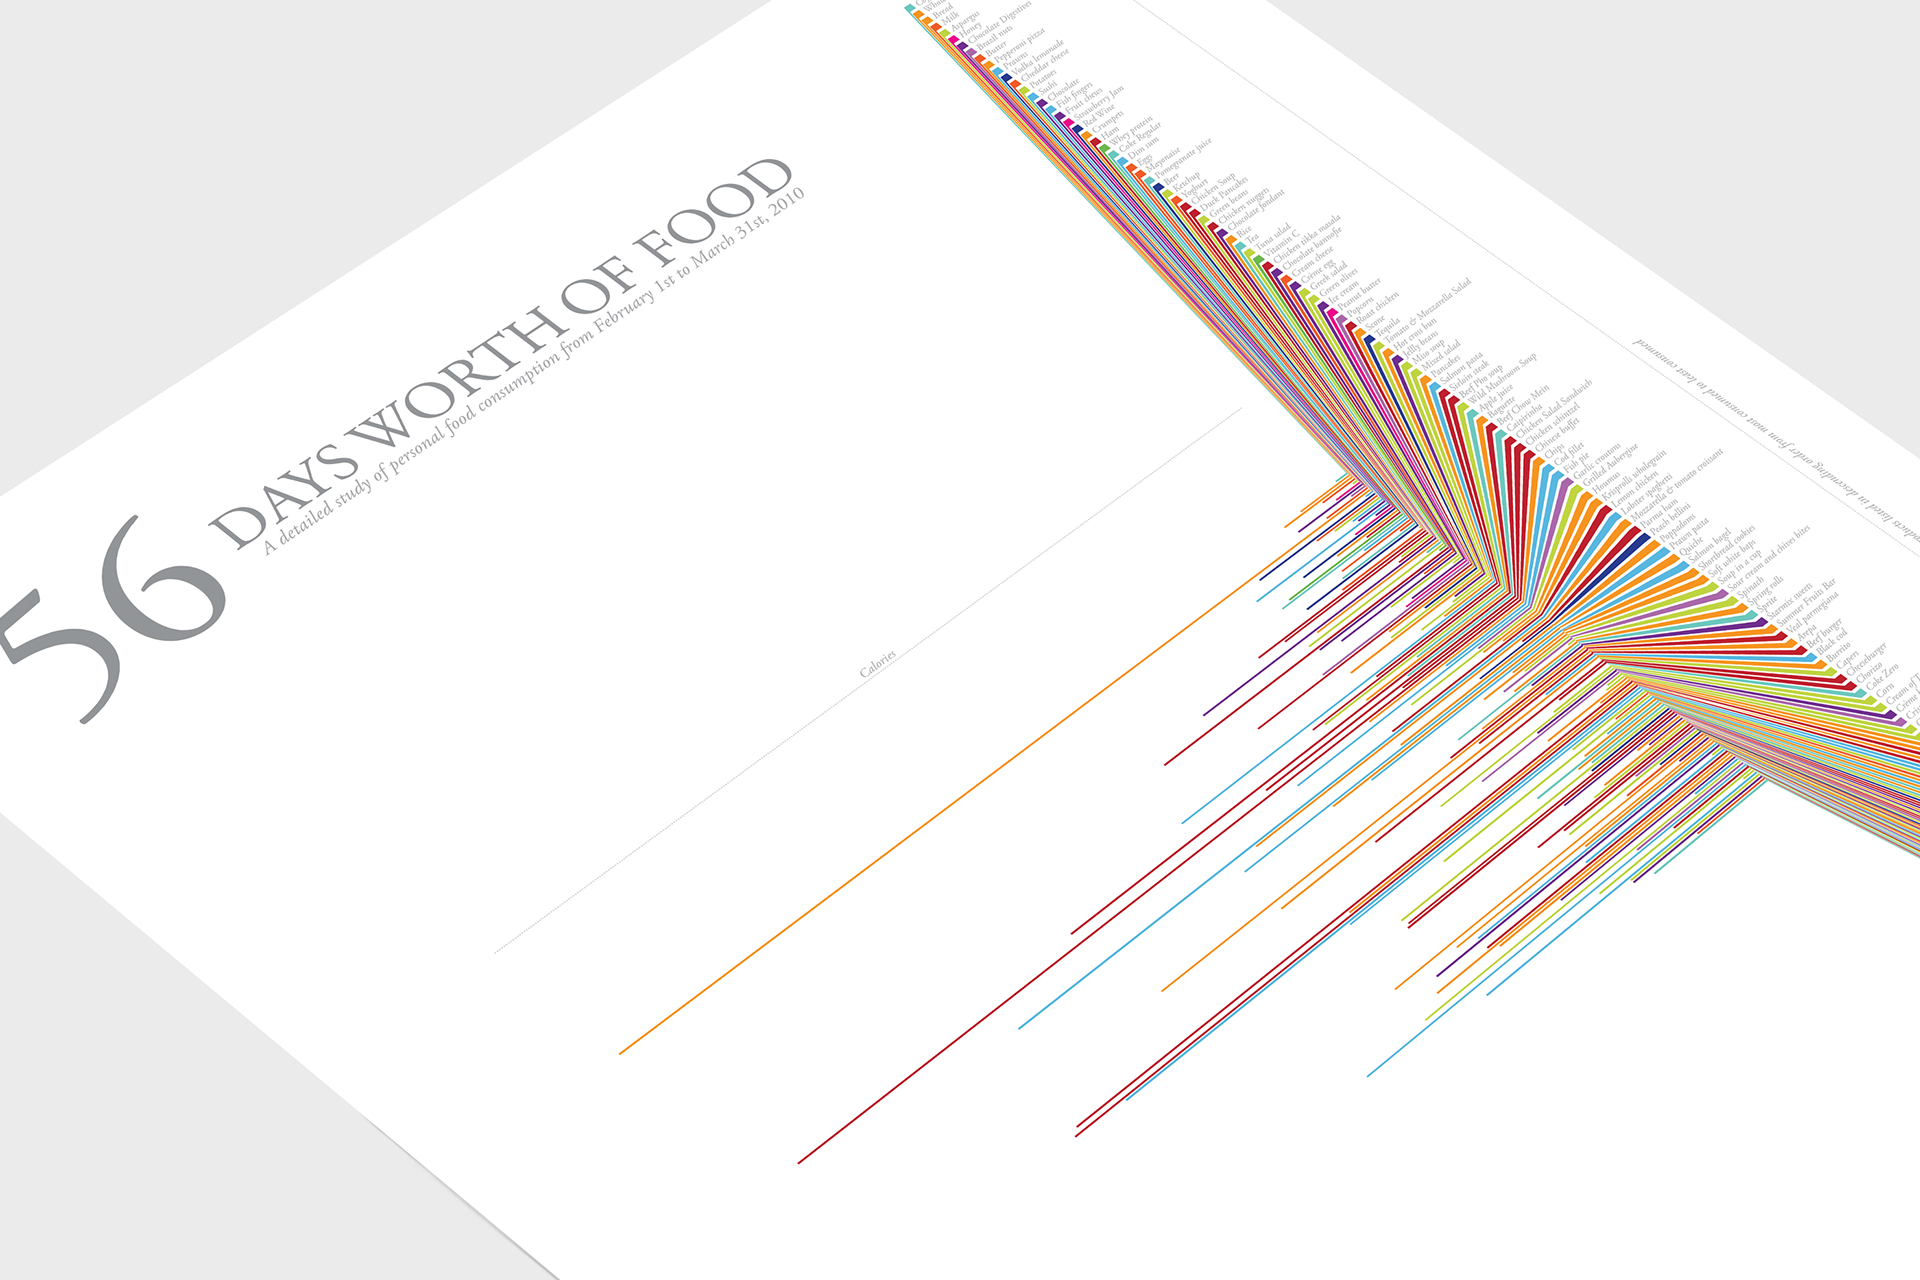
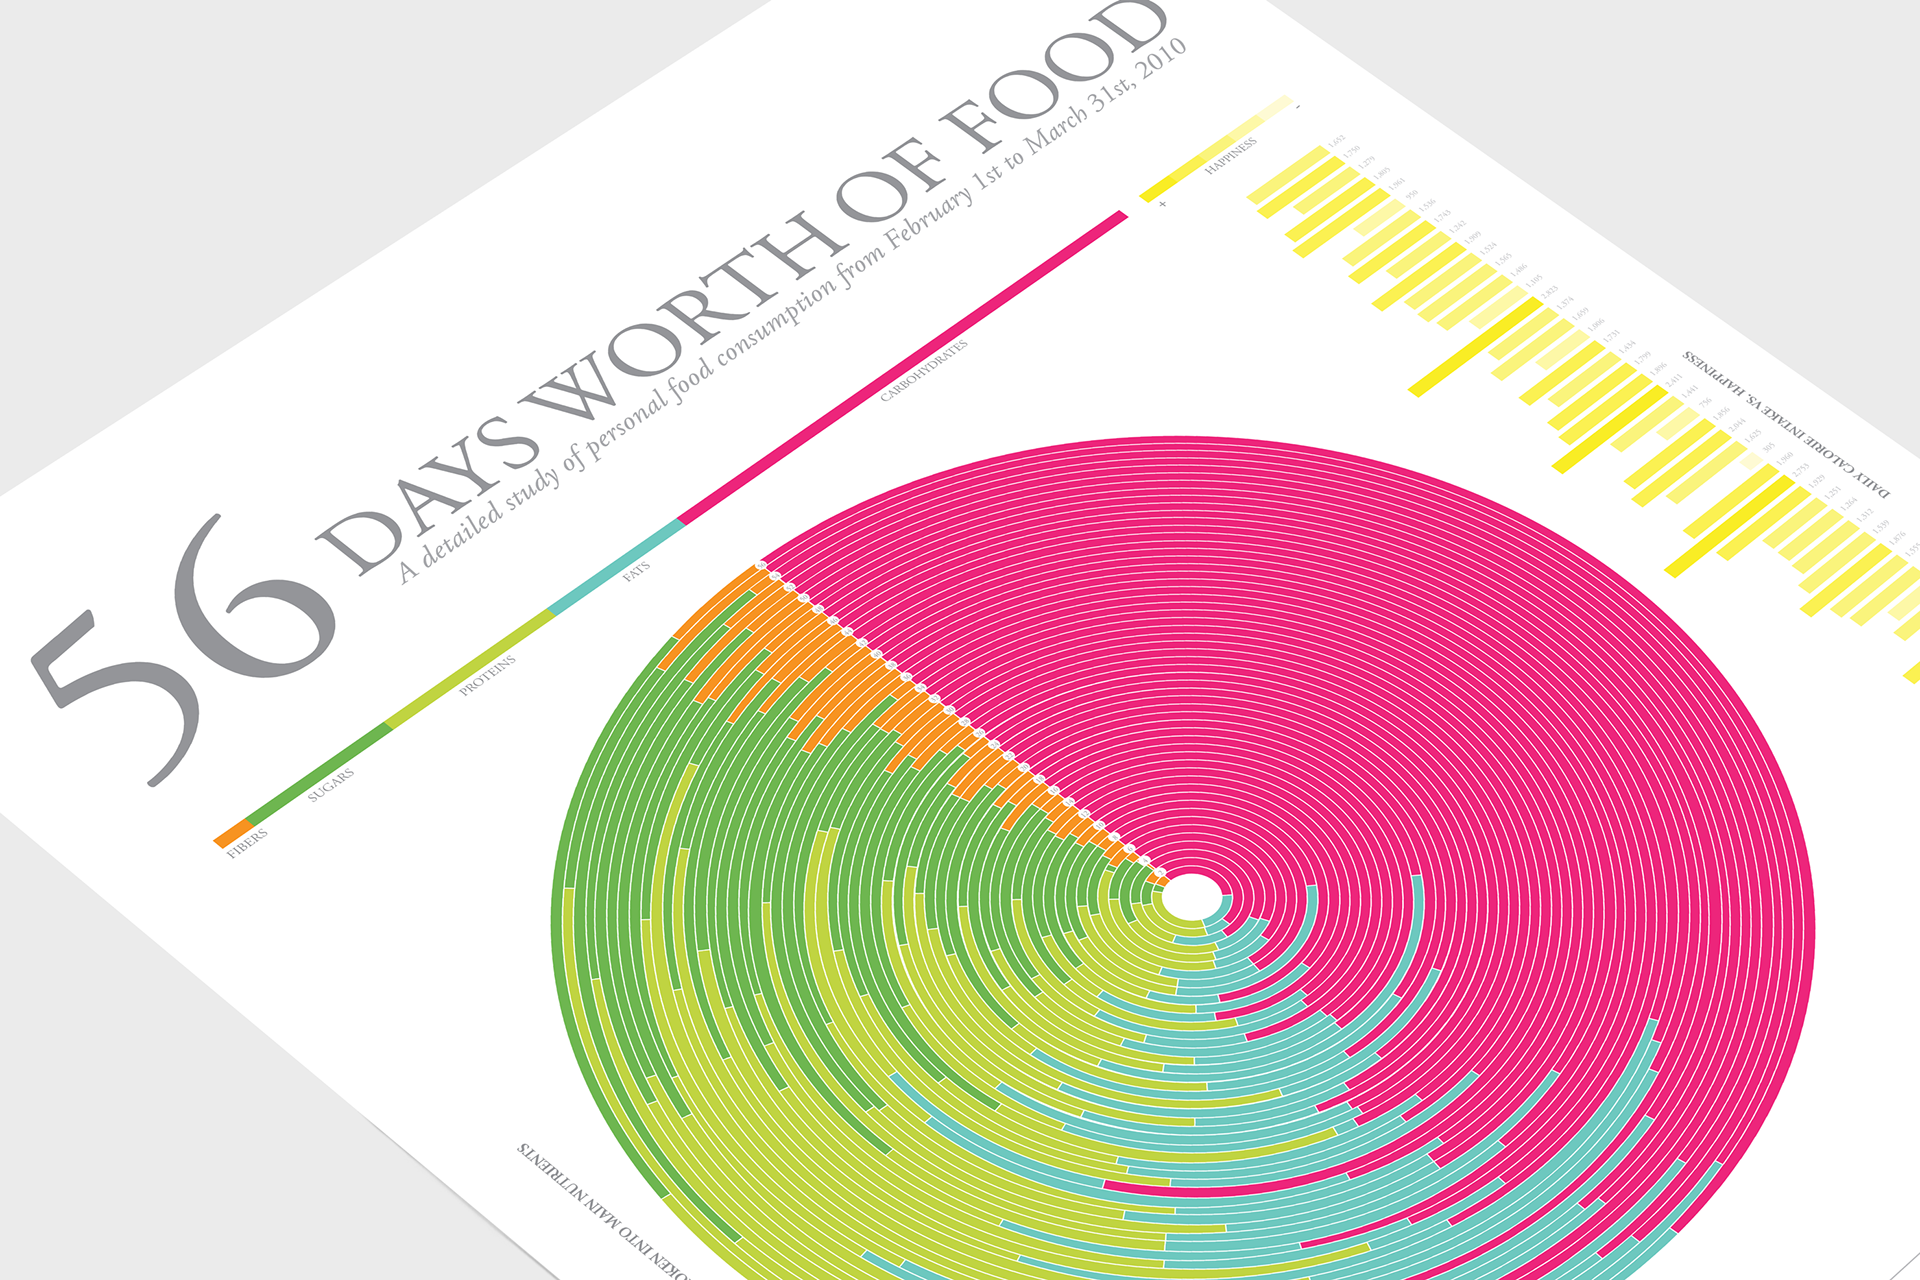
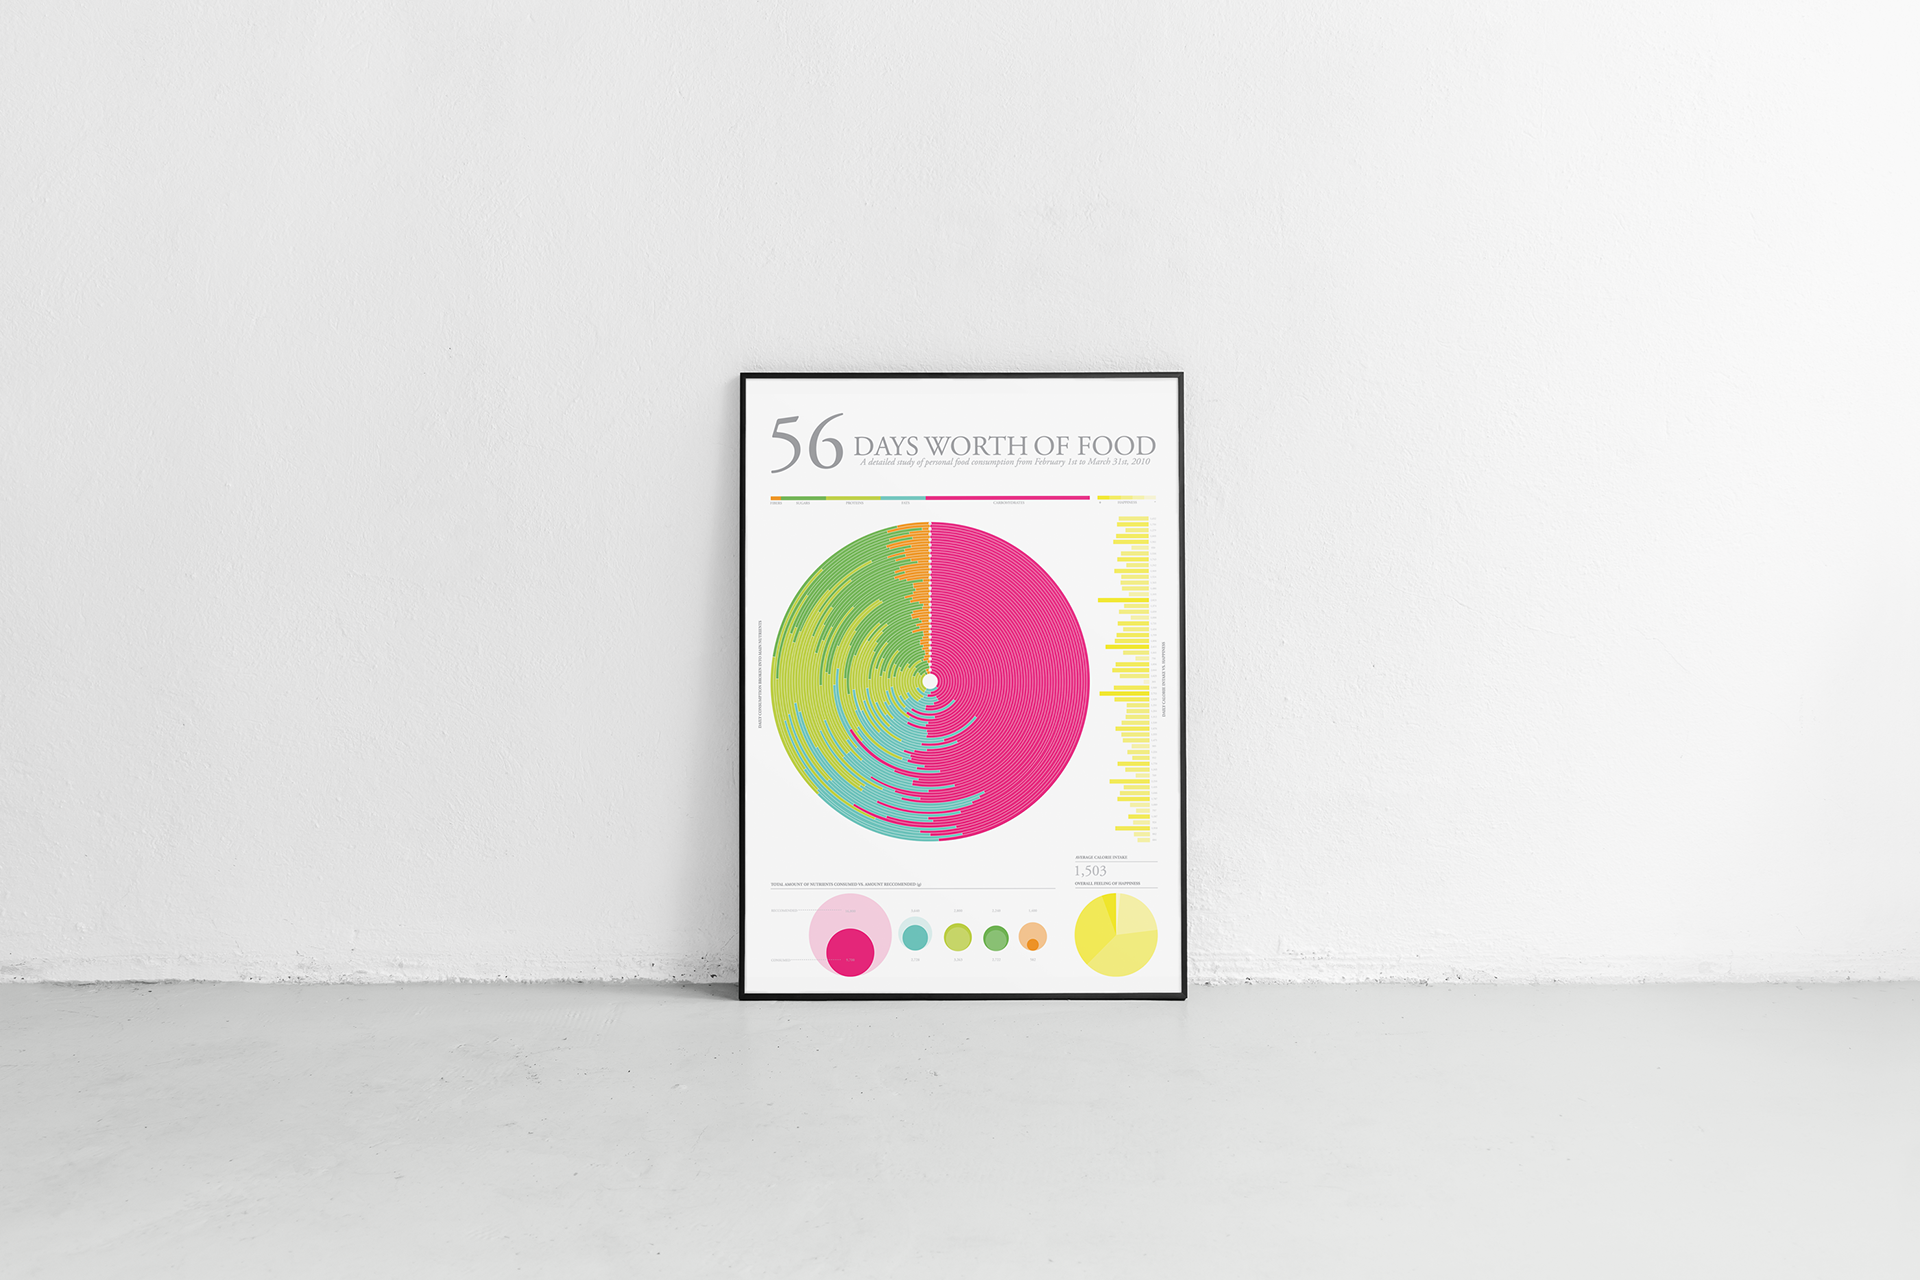
56 days worth of food
A detailed study of personal food consumption from February 1st to March 31st, 2010. The data is visualised in two ways: the first depicts the food I eat most ranked by quantity eaten versus calorie content of each food. The second is a breakdown of my daily consumption into main nutrients and also a comparison between calorie intake versus perceived happiness. Selected to be published on The Book of Circles: Visualizing Spheres of Knowledge.
Keynote
Women in Data Science
Intro to Data Visualization
Intro to Data Visualization